
Eastern Shore Opinion Poll
Washington College polled Maryland registered voters in the 1st Congressional District about some of their political preferences between October 28 and November 1.
Key Takeaways

Eastern Shore Voters Differ from State
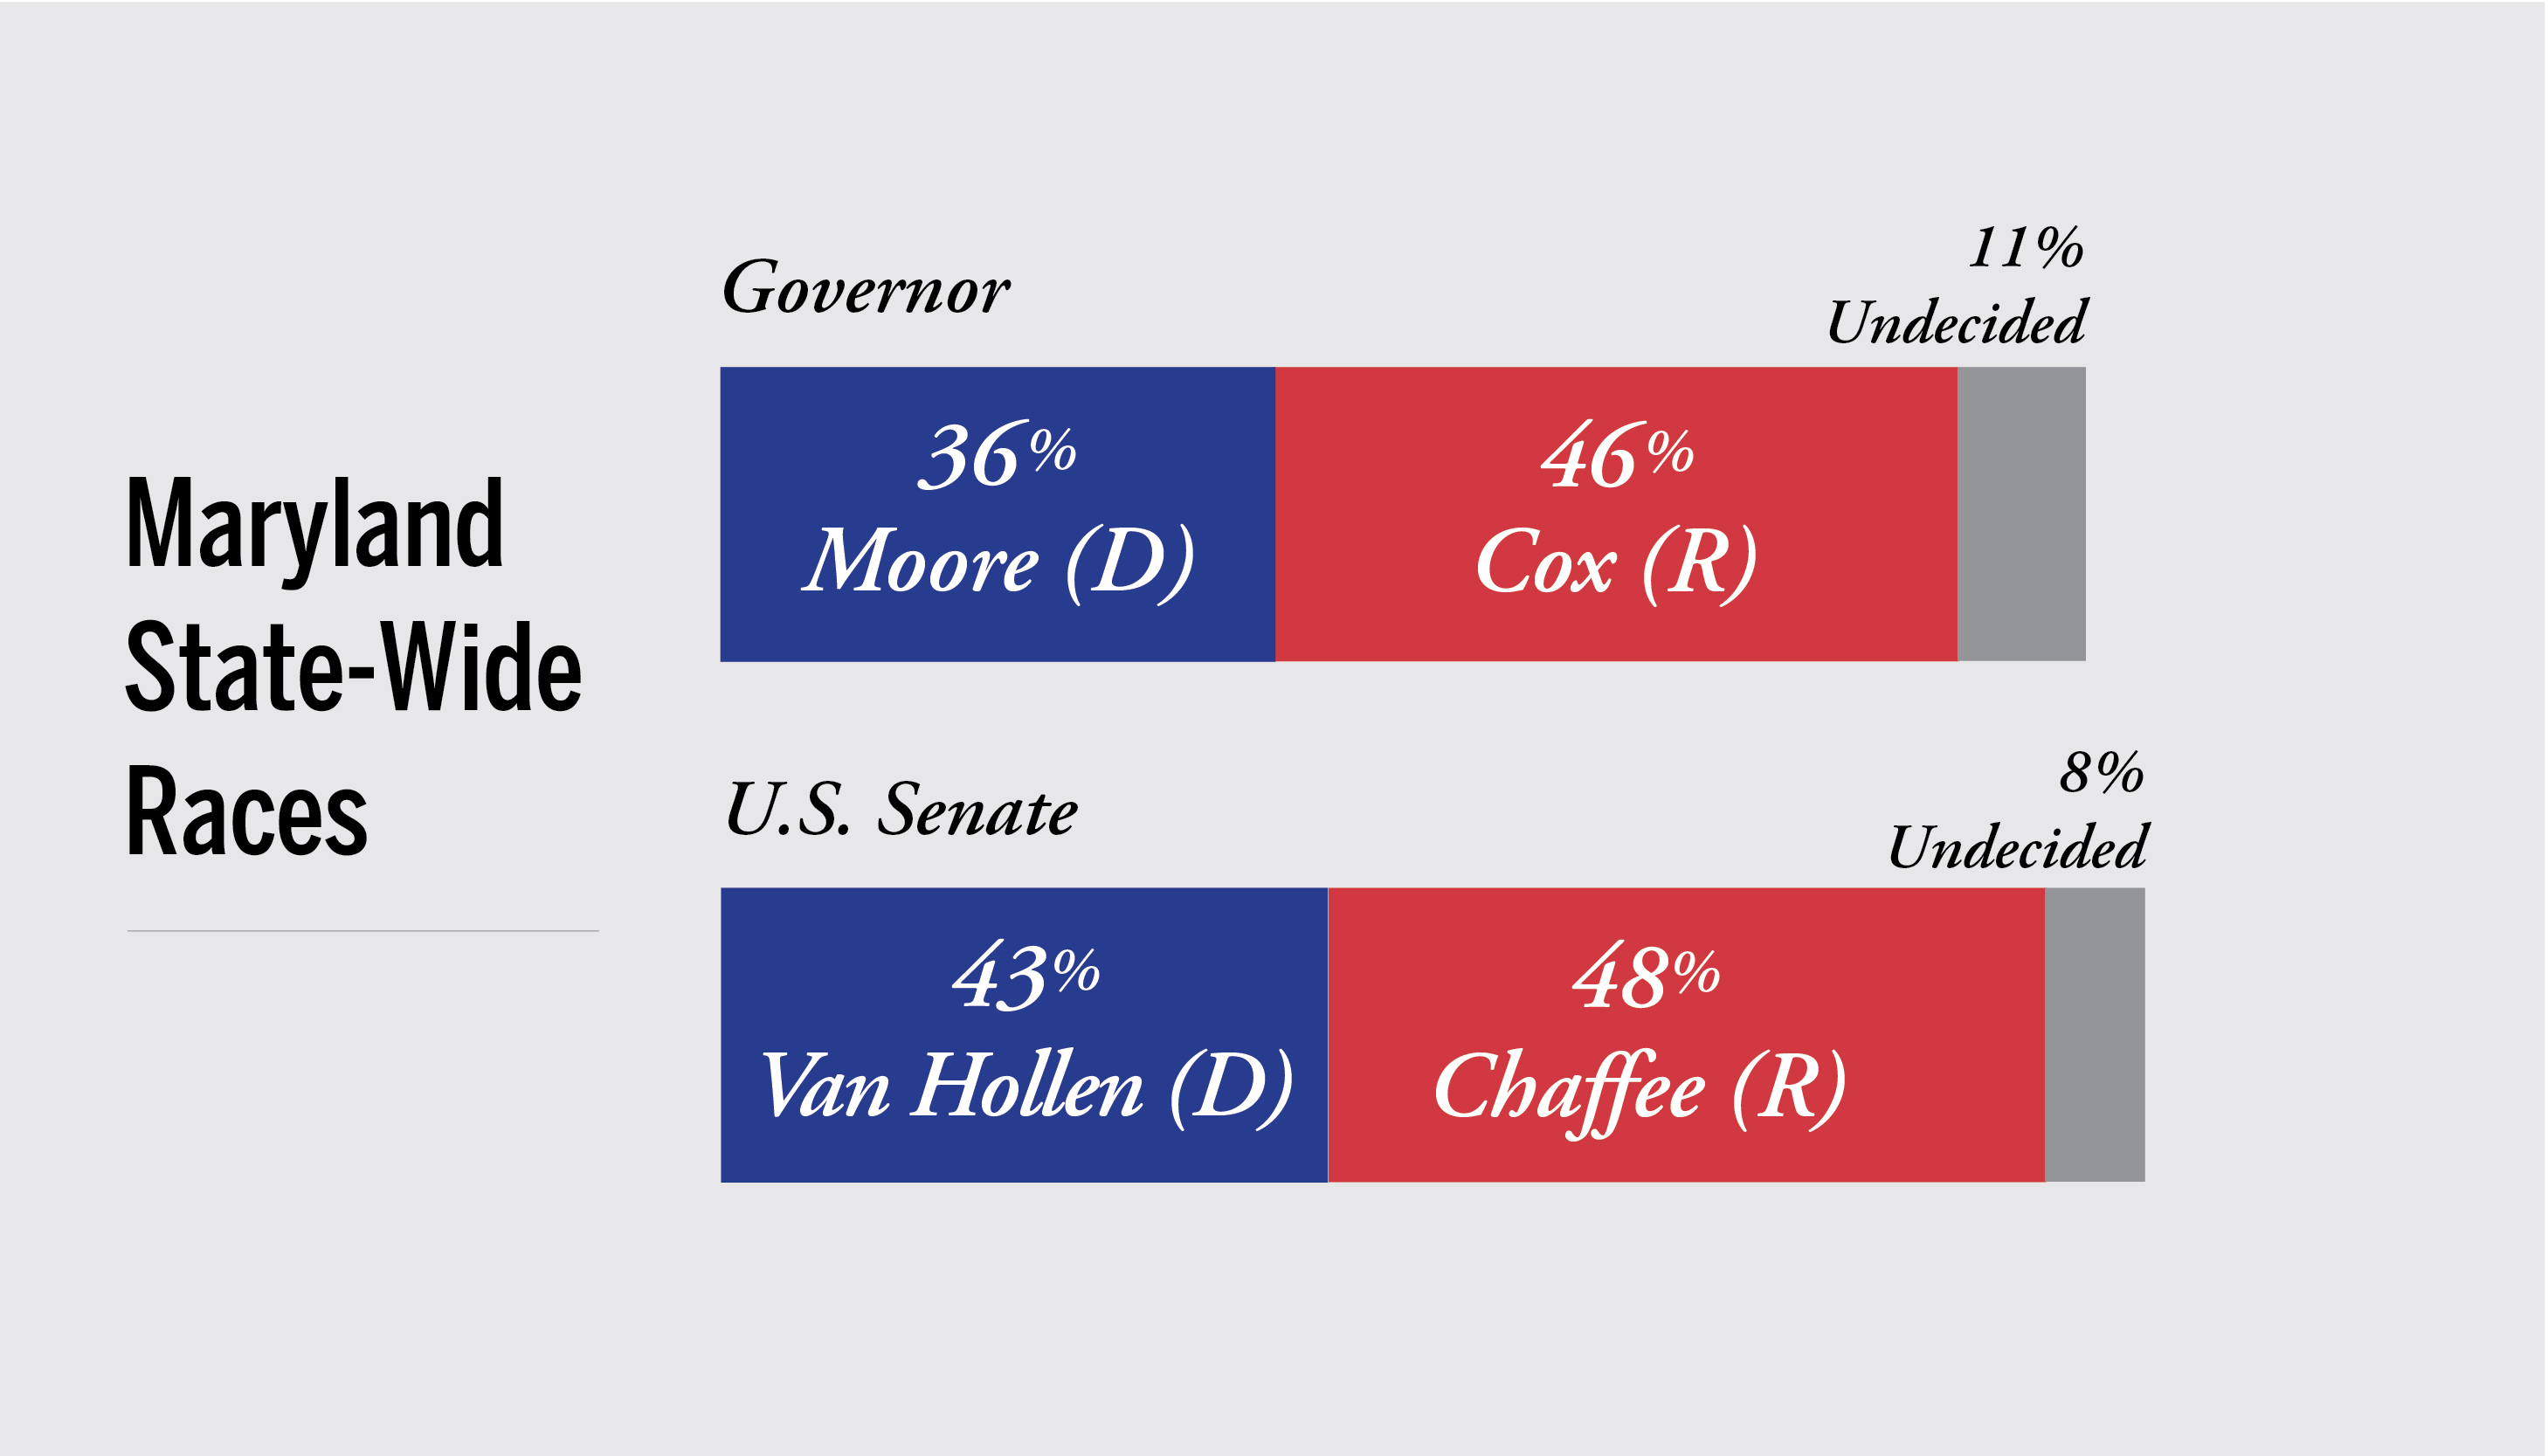
In contrast with state-wide polling, likely Eastern Shore voters prefer Dan Cox (R) for Maryland governor over his opponent Wes Moore (D) by ten percentage points in the race to succeed Republican Larry Hogan. The U.S. Senate seat held by Chris van Hollen (D) shows the incumbent trailing his opponent Chris Chaffe (R) by five percentage points 48% to 43%.

Republican Harris Holds Lead to Represent District
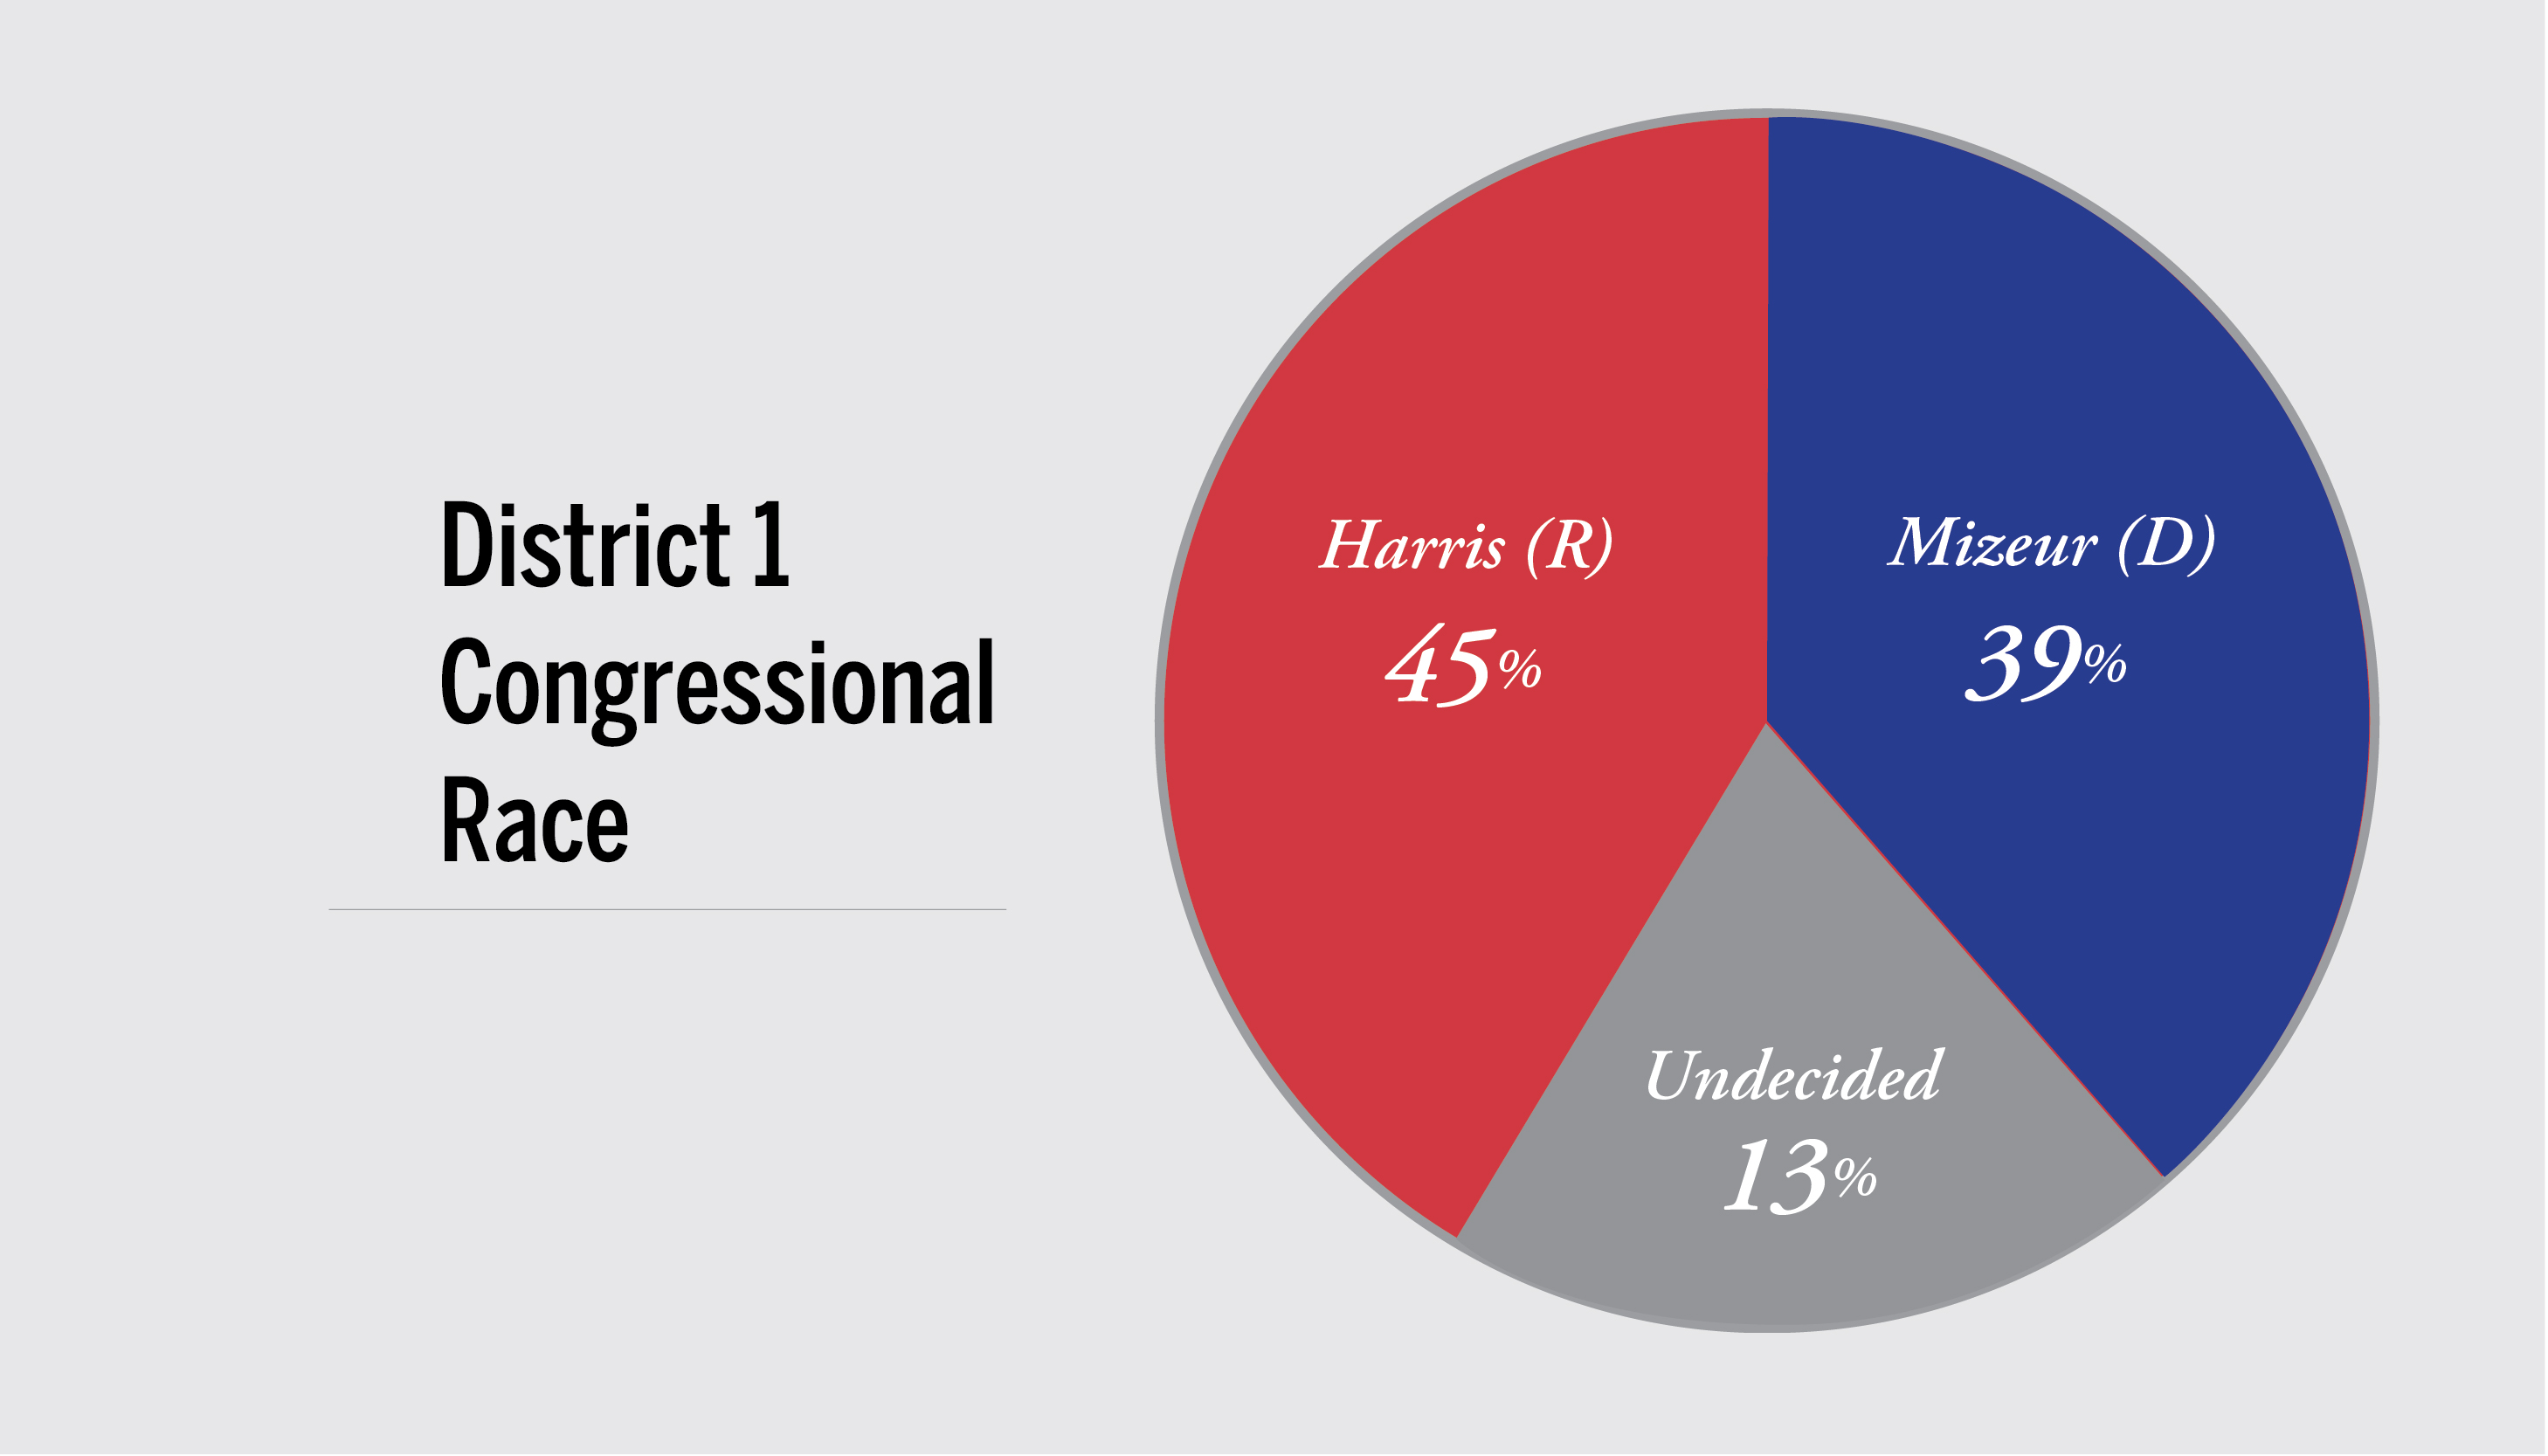
Andy Harris (R) holds a lead of seven percentage points over his opponent Heather Mizeur (D) in the race to represent the district in the House of Representatives.

Political Divide on the Eastern Shore
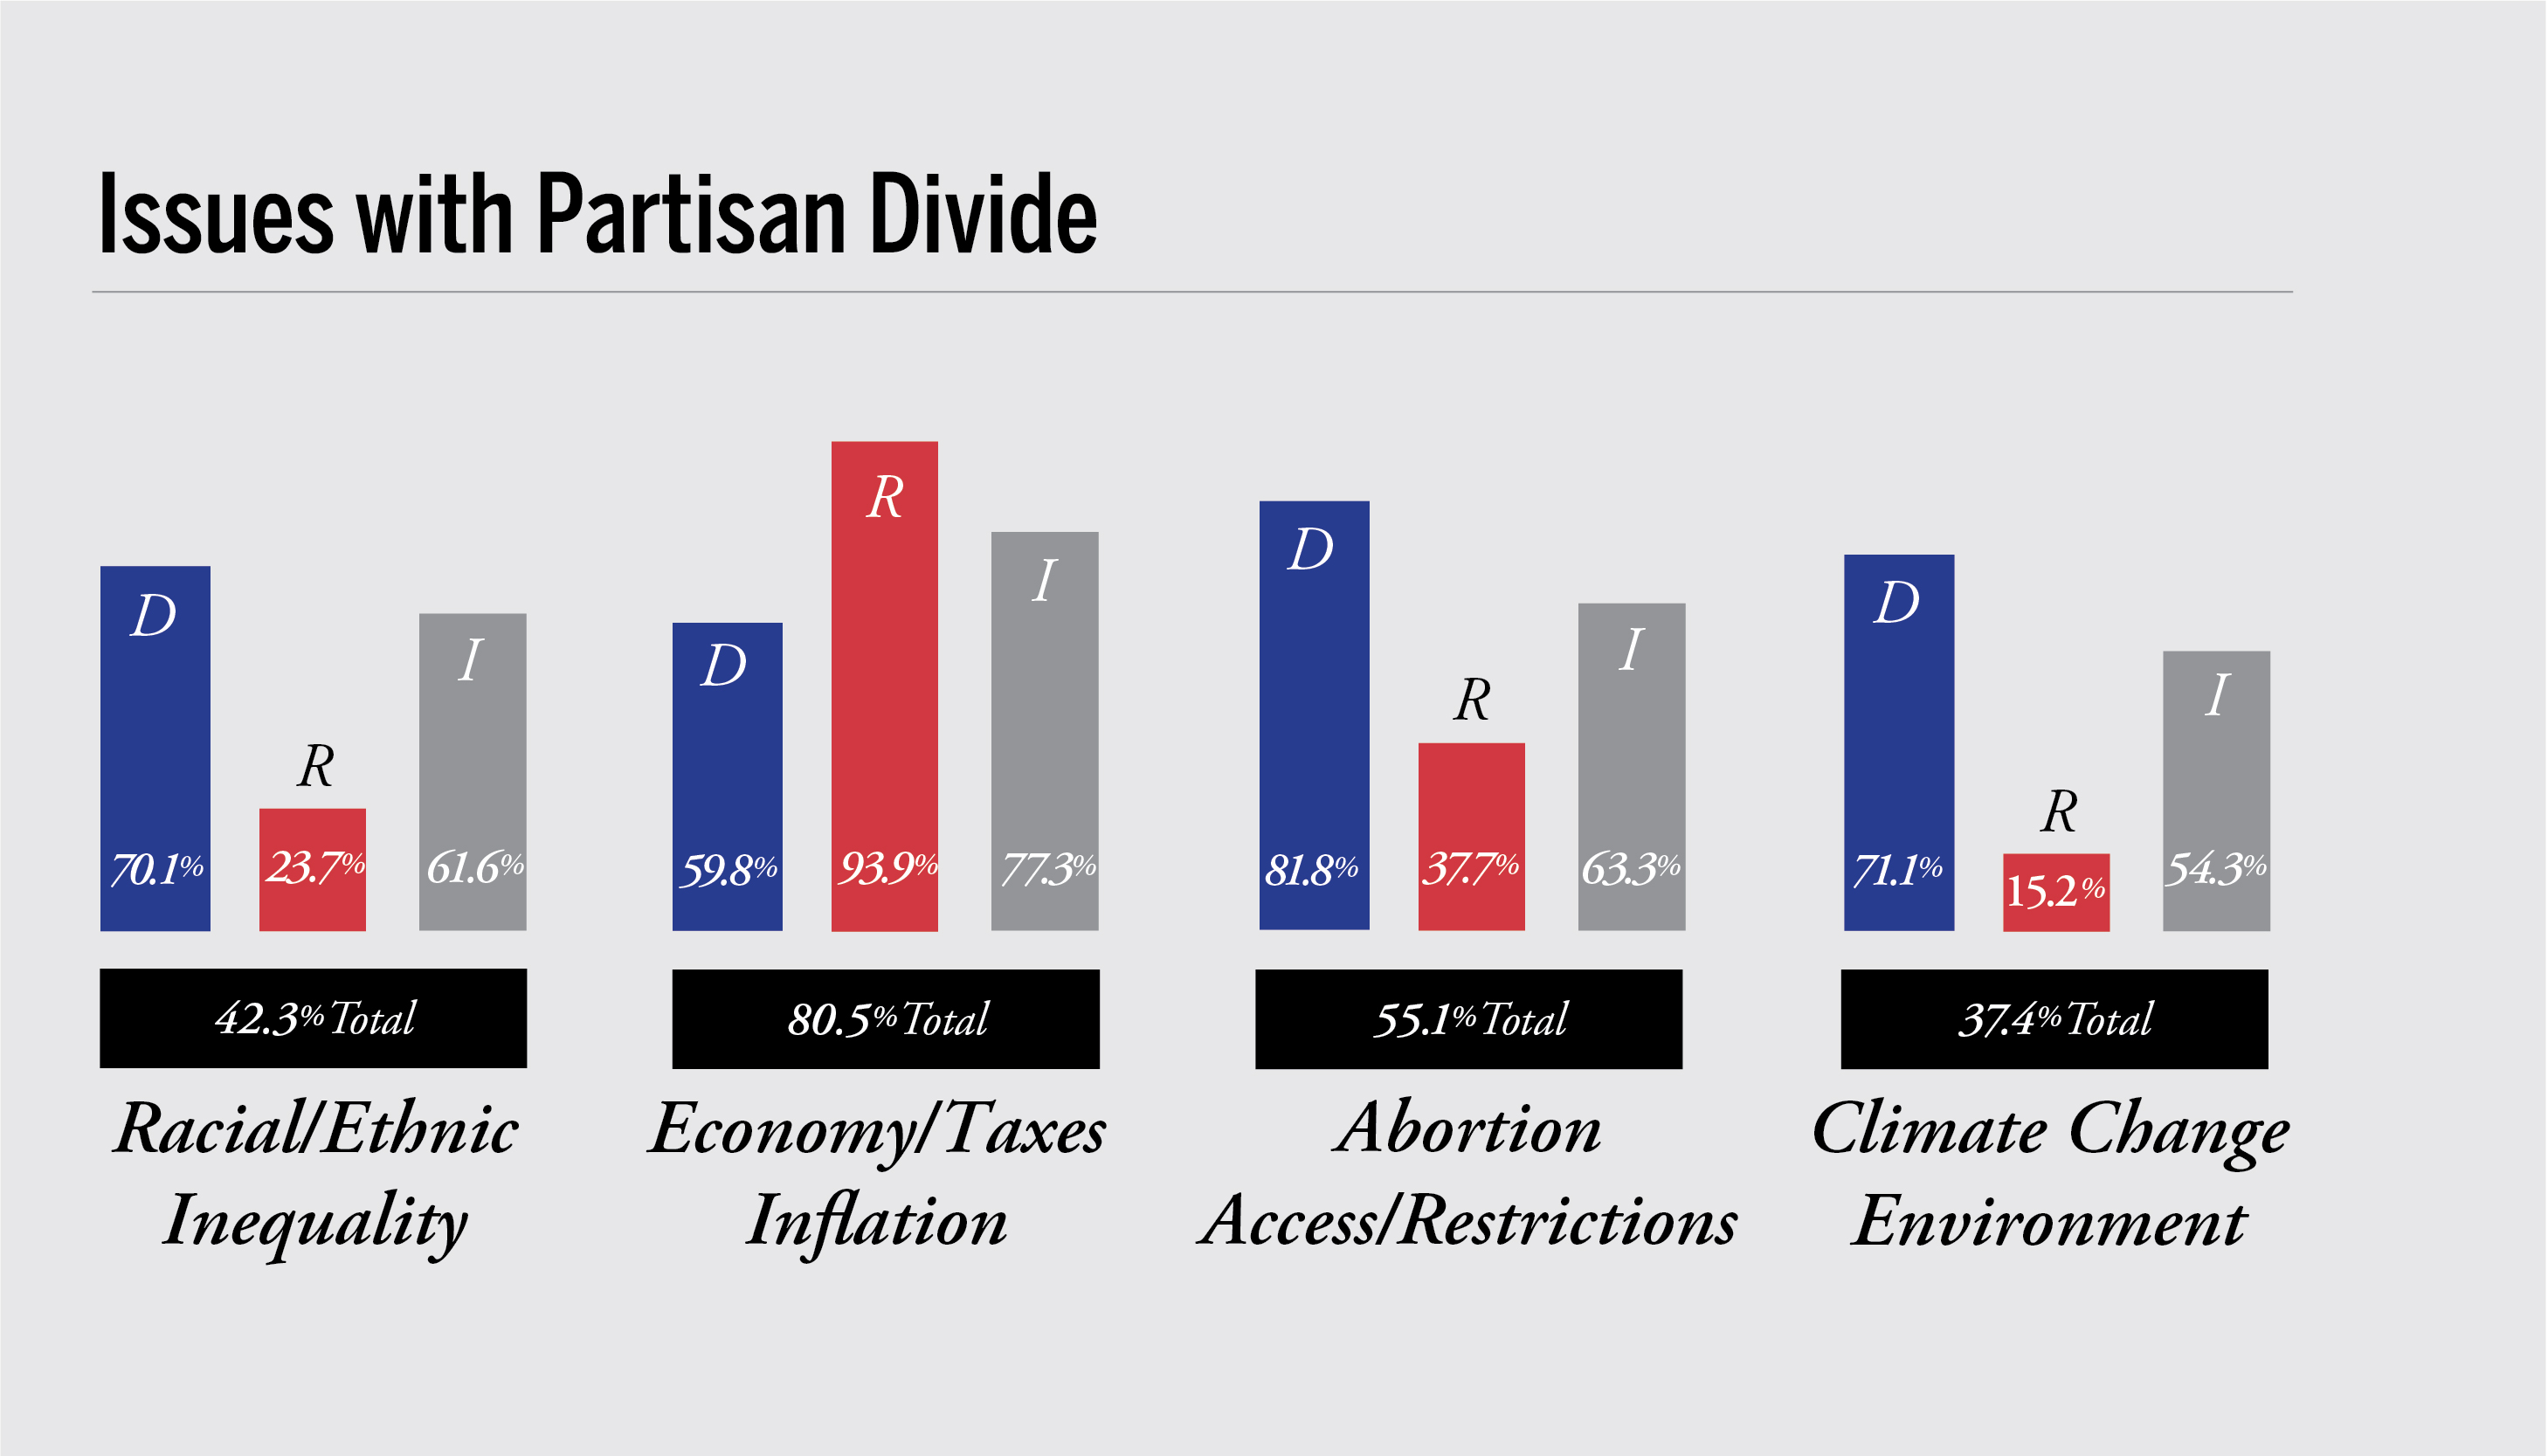
The poll illustrates a partisan divide over what voters consider to be the most important issues facing the district. More Republicans view the economy, taxes and inflation as an important while more Democrats view racial and ethnic inequality, abortion access and restrictions and climate change and the environment as important issues.
Survey Findings
Q1: To ensure we are reaching people of all ages, would you please select the year you were born.
- 18 – 29 ………. 19.1%
- 30 – 39 ………. 14.5%
- 40 – 49 ………. 14.9%
- 50 – 59 ………. 18.5%
- 60 + ………. 33.0%
Q2: What is your current gender identity?
- Male 48.0%
- Female 51.8%
- Other Gender Identity 0.2%
Q3: Generally speaking, do you usually think of yourself as a Democrat, Republican, or Independent? [Republican/Republican Respondents: Would you call yourself a strong Republican/Democrat or a not so strong Republican/Democrat?][Independent Respondents: Do you think of yourself as closer to the Democratic Party or the Republican Party (or neither)?]
- Democrat/Independent-Democrats 37.8%
- Republican/Independent-Republicans 59.8%
- Pure Independent 2.3%
Q4: In general, how would you describe your political views?
- Conservative 47.6%
- Middle of the Road 30.8%
- Liberal 21.5%
Q5: In general, are you satisfied or dissatisfied with the way things are going in Maryland at this time?
- Very satisfied 5.3%
- Somewhat satisfied 28.5%
- Neither satisfied nor dissatisfied 23.6%
- Somewhat dissatisfied 15.6%
- Very dissatisfied 26.9%
Q6: Over the course of the next year, do you expect the economy in the State of Maryland to get better, stay the same, or get worse?
- Get much better 2.0%
- Get somewhat better 20.1%
- Stay the same 22.3%
- Get somewhat worse 36.1%
- Get much worse 19.5%
Q7: In talking to people about the 2020 Presidential Election, we found that a lot of people were not able to vote because they were sick or just didn’t have the time. Which of the following statements best describes you?
- I DID NOT vote in the 2020 Presidential Election 8.3%
- I thought about voting in the 2020 Presidential Election, but DIDN’T 5.1%
- I usually vote, but I DIDN’T vote in the 2020 Presidential Election 3.8%
- I am sure that I VOTED in the 2020 Presidential Election 82.6%
Q7b: Which candidate for President did you vote for in the 2020 Presidential Election? (Asked only of those who answered “I am sure that I VOTED in 2020 Presidential Election in Q7: N = 567)
- Joe Biden 34.8%
- Donald Trump 59.6%
- Other Candidate 3.5%
- I don’t Remember 2.1%
Q8: Did you vote in the Maryland Gubernatorial Primary Election this past July?
- Yes 53.6%
- No 45.0%
- Not Sure 1.4%
Q9: Which of the following statements best describes you?
- I Probably will NOT vote in the November Midterm Election 7.2%
- I MAY vote in the November Midterm Election 11.5%
- Unless some emergency comes up, I WILL vote in the November Midterm Election 5.8%
- I DEFINITELY WILL vote in the November Midterm Election 71.8%
- Not sure 3.6%
Q10: If the Maryland Gubernatorial Election was being held today, which candidate would you vote for?
Full Sample Likely Voters
- Dan Cox (Republican Party) (OPTION ROTATED) 40.4% 46.0%
- Wes Moore (Democratic Party (OPTION ROTATED) 35.1% 36.7%
- David Lashar (Libertarian Party) 3.1% 3.4%
- Nancy Wallace (Green Party) 0.1% 0.1%
- David Harding (Working Class Party) 1.9% 1.8%
- I’m not sure 19.2% 11.8%
Q11: If the Maryland Attorney General Election was being held today, which candidate would you vote for?
Full Sample Likely Voters
- Michael Peroutka (Republican Party) (OPTION ROTATED) 44.5% 47.6%
- Anthony Brown (Democratic Party) (OPTION ROTATED) 37.7% 39.4%
- I’m not sure 17.8% 13.0%
Q12: If the US Senate Election was being held today, which candidate would you vote for?
Full Sample Likely Voters
- Chris Chaffee (Republican Party) (OPTION ROTATED) 47.0% 48.3%
- Chris Van Hollen (Democratic Party (OPTION ROTATED) 38.1% 43.2%
- I’m not sure 15.0% 8.5%
Q13: If the US House of Representative Election was being held today, which candidate would you vote for?
Full Sample Likely Voters
- Andy Harris (Republican Party) (OPTION ROTATED) 43.7% 45.1%
- Heather Mizeur (Democratic Party) (OPTION ROTATED) 36.4% 38.8%
- Daniel Thibeault (Libertarian Party) 2.0% 2.8%
- I’m not sure 17.9% 13.2%
Q14: In the upcoming election, Maryland voters will be asked whether they support or oppose a Maryland Constitutional Amendment that would legalize the use of Cannabis by an individual who is at least 21 years of age or older in the State of Maryland. If the election was being held today, would you support or oppose this Constitutional Amendment?
Full Sample Likely Voters
- Support Legalizing the use of Cannabis (OPTION ROTATED) 68.5% 74.0%
- Oppose Legalizing the use of Cannabis (OPTION ROTATED) 24.8% 21.0%
- I’m not sure 6.7% 4.9%
Q15: Regardless of who you plan to vote for, please rate how favorable or unfavorable you feel toward each candidate:
Full Sample Likely Voters
- Dan Cox (Republican Candidate for Governor)
- Very Favorable 14.7% 15.5%
- Favorable 28.2% 28.2%
- Neither Favorable nor Unfavorable 15.8% 11.0%
- Unfavorable 9.7% 11.6%
- Very Unfavorable 22.9% 26.7%
- Not sure 8.6% 6.9%
Wes Moore (Democratic Candidate for Governor)
- Very Favorable 18.1% 15.4%
- Favorable 18.7% 21.7%
- Neither Favorable nor Unfavorable 25.1% 21.6%
- Unfavorable 11.3% 12.2%
- Very Unfavorable 17.1% 20.8%
- Not sure 9.6% 8.4%
Michael Peroutka (Republican Candidate for Attorney General)
- Very Favorable 12.3% 12.7%
- Favorable 26.4% 25.7%
- Neither Favorable nor Unfavorable 26.7% 26.5%
- Unfavorable 13.8% 11.5%
- Very Unfavorable 8.8% 13.0%
- Not sure 11.9% 10.5%
Anthony Brown (Democratic Candidate for Attorney General)
- Very Favorable 12.0% 14.6%
- Favorable 21.0% 21.0%
- Neither Favorable nor Unfavorable 26.4% 25.7%
- Unfavorable 14.8% 11.5%
- Very Unfavorable 15.7% 18.1%
- Not sure 10.1% 9.1%
Chris Chaffee (Republican Candidate for US Senate)
- Very Favorable 8.6% 9.0%
- Favorable 26.8% 27.9%
- Neither Favorable nor Unfavorable 33.6% 30.4%
- Unfavorable 11.7% 14.3%
- Very Unfavorable 9.1% 10.7%
- Not sure 10.0% 7.6%
Chris Van Hollen (Democratic Candidate for US Senate)
- Very Favorable 17.5% 19.2%
- Favorable 18.9% 18.8%
- Neither Favorable nor Unfavorable 25.0% 23.8%
- Unfavorable 13.2% 13.1%
- Very Unfavorable 17.7% 20.9%
- Not sure 7.7% 4.2%
Andy Harris (Republican Candidate for US House)
- Very Favorable 20.9% 23.6%
- Favorable 21.9% 17.4%
- Neither Favorable nor Unfavorable 18.1% 18.1%
- Unfavorable 8.2% 8.4%
- Very Unfavorable 23.9% 28.5%
- Not sure 6.8% 3.9%
Heather Mizeur (Democratic Candidate for US House)
- Very Favorable 15.0% 18.4%
- Favorable 20.9% 20.4%
- Neither Favorable nor Unfavorable 29.7% 26.0%
- Unfavorable 9.6% 9.3%
- Very Unfavorable 16.6% 20.6%
- Not sure 8.2% 5.3%
Q16: How important are each of the following characteristics to you when deciding which political candidate to vote for?
- Candidate reflects my political values and beliefs
- Very important 63.5%
- Somewhat important 33.6%
- Not too important 1.4%
- Not important at all 1.5%
- Candidate is willing to compromise with those of different political perspectives
- Very important 46.7%
- Somewhat important 42.6%
- Not too important 5.2%
- Not important at all 5.4%
- Candidate’s policies will benefit my own personal needs
- Very important 33.6%
- Somewhat important 49.6%
- Not too important 12.1%
- Not important at all 4.6%
- Candidate is loyal to my political party
- Very important 28.2%
- Somewhat important 39.4%
- Not too important 23.2%
- Not important at all 9.2%
- Candidate is honest and trustworthy
- Very important 90.6%
- Somewhat important 6.9%
- Not too important 0.9%
- Not important at all 1.4%
- Candidate will prioritize American interests over party interests
- Very important 85.6%
- Somewhat important 8.6%
- Not too important 2.8%
- Not important at all 2.9%
Q17: How important are each of the following issues in making your decision about who to vote for in the upcoming election? (ITEMS ROTATED)
Full Sample Likely Voters
- Crime/Guns/Public Safety
- Very important 68.1% 71.3%
- Somewhat important 24.7% 23.2%
- Not too important 3.3% 3.9%
- Not important at all 1.9% 1.2%
- Not sure 1.8% 0.2%
- Economy/Taxes/Inflation
- Very important 78.7% 80.5%
- Somewhat important 16.3% 16.0%
- Not too important 2.9% 3.1%
- Not important at all 0.3% 0.4%
- Not sure 1.6% 0.0%
- Racial/Ethnic Inequality
- Very important 44.4% 42.3%
- Somewhat important 25.1% 26.5%
- Not too important 11.9% 10.2%
- Not important at all 15.9% 19.4%
- Not sure 2.6% 1.5%
- Education/Public Schools
- Very important 74.1% 74.5%
- Somewhat important 18.8% 17.5%
- Not too important 4.3% 6.2%
- Not important at all 0.8% 1.3%
- Not sure 1.9% 0.4%
- Health Care Access/Quality
- Very important 64.2% 67.1%
- Somewhat important 26.3% 26.3%
- Not too important 4.6% 3.6%
- Not important at all 3.0% 2.7%
- Not sure 1.8% 0.1%
- Abortion Access/Restrictions
- Very important 53.3% 55.1%
- Somewhat important 21.9% 20.1%
- Not too important 12.1% 13.4%
- Not important at all 10.2% 8.8%
- Not sure 2.9% 2.5%
- Infrastructure (Roads/Bridges)
- Very important 41.8% 41.6%
- Somewhat important 43.6% 49.6%
- Not too important 10.9% 7.6%
- Not important at all 1.9% 1.0%
- Not sure 1.7% 0.1%
- Climate Change/Environment
- Very important 35.4% 37.4%
- Somewhat important 26.0% 24.2%
- Not too important 19.7% 16.7%
- Not important at all 16.8% 21.4%
- Not sure 1.9% 0.3%
- Election Integrity/Voting Rights
- Very important 72.4% 79.3%
- Somewhat important 16.1% 12.9%
- Not too important 6.3% 6.7%
- Not important at all 2.6% 0.8%
- Not sure 2.4% 0.1%
- Immigration/Border Security
- Very important 60.3% 67.4%
- Somewhat important 22.6% 19.6%
- Not too important 9.4% 8.7%
- Not important at all 5.8% 4.0%
- Not sure 1.8% 0.2%
Q18: Please tell me how much trust and confidence you have in each to do what is right.
- Local Government (e.g. Town and County)
- A great deal 13.4%
- A lot 15.0%
- A moderate amount 39.6%
- A little 19.8%
- None at all 11.8%
- Maryland State Government
- A great deal 18.5%
- A lot 14.8%
- A moderate amount 31.1%
- A little 20.0%
- None at all 14.8%
- US Federal Government
- A great deal 14.7%
- A lot 7.7%
- A moderate amount 20.9%
- A little 24.8%
- None at all 31.8%
Q19: How confident are you that the upcoming election in Maryland will be conducted fairly and accurately?
- Very confident 39.6%
- Somewhat confident 39.4%
- Not too confident 14.6%
- Not at all confident 6.4%
Q20: The U.S. Supreme Court recently overturned Roe v. Wade, the 1973 U.S. Supreme Court decision that affirmed a constitutional right to an abortion. How much do you favor or oppose the U.S. Supreme Court overturning Roe v. Wade?
- Strongly favor overturning Roe v. Wade 21.5%
- Favor 9.2%
- Neither favor nor oppose 21.8%
- Oppose 7.8%
- Strongly oppose overturning Roe v. Wade 39.6%
Q21: Please rate how favorable or unfavorable you feel toward each person.
- Former President Donald Trump
- Very favorable 26.2%
- Favorable 20.8%
- Neither favorable nor unfavorable 12.8%
- Unfavorable 6.9%
- Very unfavorable 33.2%
- President Joe Biden
- Very favorable 6.8%
- Favorable 17.3%
- Neither favorable nor unfavorable 14.6%
- Unfavorable 15.0%
- Very unfavorable 46.4%
- Maryland Governor Larry Hogan
- Very favorable 31.9%
- Favorable 31.8%
- Neither favorable nor unfavorable 23.1%
- Unfavorable 7.1%
- Very unfavorable 5.9%
Q22: What is your highest level of Education
- Less than High School Graduate 7.2%
- High School Graduate 31.3%
- Some College 31.9%
- College Graduate + 29.5%
Q23: What is your present religion, if any?
- Protestant/Christian 40.8%
- Roman Catholic 16.7%
- Jewish 2.3%
- Muslim 0.4%
- Mormon; Eastern or Greek Orthodox; Buddhist; or Hindu (Combined) 1.7%
- Atheist; Agnostic; or Nothing in Particular (Combined) 19.8%
- Something else 5.0%
- Prefer not to say 13.1%
Q24: What is your race/ethnicity? Please mark all that apply.
- White, not-Hispanic/Latino 79.2%
- Hispanic/Latino 2.8%
- Black or African American 14.4%
- Asian or Asian American 1.4%
- Other (Combining responses for Middle Eastern or Arab; American Indian or Native American; Other Race/Ethnicity; and participants who indicated membership in multiple racial/ethnic groups.) 2.1%
Q25: Thinking back to last year (2021), what was your total family’s income from all sources, before taxes?
- Less than $24,999 8.5%
- $25,000 – $49,999 16.3%
- $50,000 - $74,000 15.4%
- $75,000 - $99,999 16.9%
- $100,000 - $149,999 19.5%
- More than $150,000 14.0%
- Prefer not to say. 9.2%
Methodological Statement
Survey
The following report contains the results of an online survey of 686 registered voters in the 1st Congressional District in the State of Maryland between October 28 and November 2, 2022. Respondents were invited to participate via cell phone text messaging and were provided a $10 digital gift card upon completion. Among these participants, 597 are considered “Likely Voters” based on their responses to Survey Question #9 (“Unless some emergency comes up, I WILL vote in the November Midterm Election” or “I DEFINITELY WILL vote in the November Midterm Election”). Administration and data collection of this survey was provided by The Eagleton Center for Public Interest Polling at the Eagleton Institute of Politics, Rutgers, the State University of New Jersey (eagletonpoll.rutgers.edu).
Sampling
The margin of error for this survey is +/- 4% at a 95% level of confidence. Margins of error are higher for subsamples. In addition to sampling error, all surveys are subject to sources of non-sampling error, including question wording effects, question order effects, and non-response bias. Margin of error is not adjusted for design effects. The data has been weighted to eligible voter population targets established by the most recent five-year American Community Survey (ACS) estimates according to gender, age, race, and educational attainment. The data has also been weighted by party identity to reflect a composite score of electoral outcomes (House, Senate, President, Attorney General and Governor) in CD-01 from 2016-2020. Separate weights were calculated for both the full sample and likely voter subsample. Due to weighting and rounding, the totals provided in the frequency report may not total 100%.
Funding
The survey instrument was designed by Dr. Flavio Rogerio Hickel Jr., Director of the Washington College Eastern Shore Public Opinion Poll. The survey was funded exclusively by the Washington College Starr Center for the Study of the American Experience and the Washington College Louis L. Goldstein Program in Public Affairs. For more detailed information on the methods employed please contact Dr. Flavio Rogerio Hickel Jr at 410-778-7285 or FHickel2FREEwashcoll.